37  R11 Model Selection

Author

Brian Powers

Published

November 28, 2023

37.1 Polynomial Models predicting mpg

models <- list()
models[[1]] <- lm(mpg ~ hp, data=mtcars)
models[[2]] <- lm(mpg ~ hp + I(hp^2), data=mtcars)
models[[3]] <- lm(mpg ~ hp + I(hp^2)+ I(hp^3), data=mtcars)
models[[4]] <- lm(mpg ~ hp + I(hp^2)+ I(hp^3)+ I(hp^4), data=mtcars)
models[[5]] <- lm(mpg ~ hp + I(hp^2)+ I(hp^3)+ I(hp^4)+ I(hp^5), data=mtcars)

xrng <- c(10, 400)
xpred <- seq(xrng[1], xrng[2], length.out=50)
plot(mpg~hp, data=mtcars, xlim=xrng, ylim=c(0, 60))
for(i in 1:5){
  lines(x=xpred, y=predict(models[[i]], newdata=data.frame(hp=xpred)), col=i, lwd=2)
}
legend(300,60, legend=1:5, col=1:5, lty=1, title="Order", lwd=2)

37.2 Model Selection in mtcars

37.2.1 Look at AIC as we add predictors

names(mtcars)
 [1] "mpg"  "cyl"  "disp" "hp"   "drat" "wt"   "qsec" "vs"   "am"   "gear"
[11] "carb"
# I'll consider models to predict mpg based on all other predictors. I'll look at AIC for each model
model <- lm(mpg ~ 1 + cyl, data=mtcars)
L <- logLik(model, data=mtcars)[1]
-2*L + 2*(length(coef(model)))
[1] 167.3064
model <- lm(mpg ~ 1 + cyl+disp, data=mtcars)
L <- logLik(model, data=mtcars)[1]
-2*L + 2*(length(coef(model)))
[1] 165.1456
model <- lm(mpg ~ 1 + cyl+disp+wt, data=mtcars)
L <- logLik(model, data=mtcars)[1]
-2*L + 2*(length(coef(model)))
[1] 155.5584
model <- lm(mpg ~ 1 + cyl+disp+wt+qsec, data=mtcars)
L <- logLik(model, data=mtcars)[1]
-2*L + 2*(length(coef(model)))
[1] 155.3037
# Continue until no decrease in AIC is observed

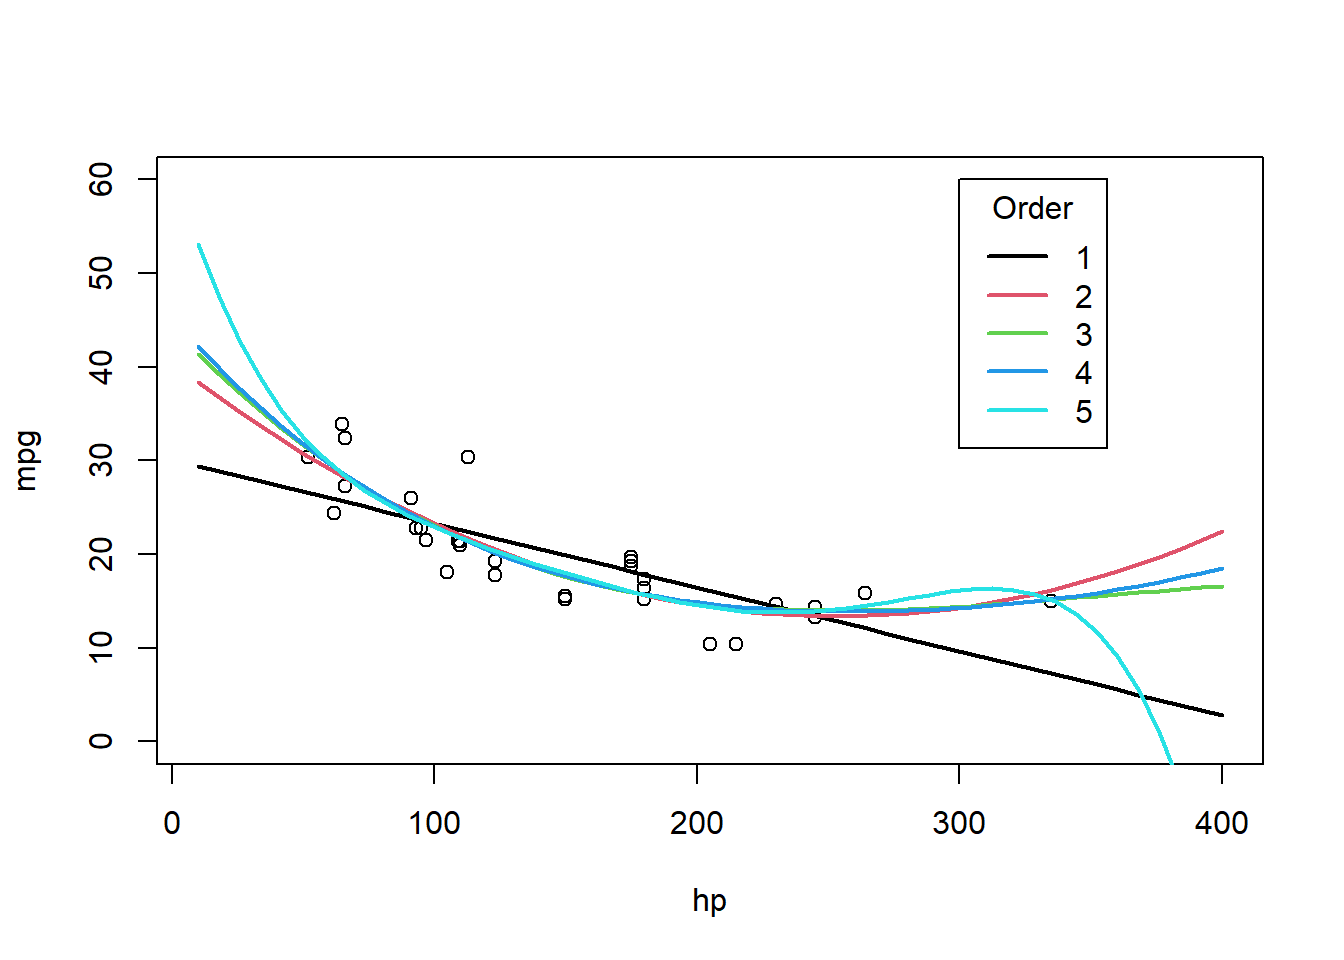
In this code we will compare different multiple regression models to predict miles per gallon from the various predictor variables in the mtcars dataset.

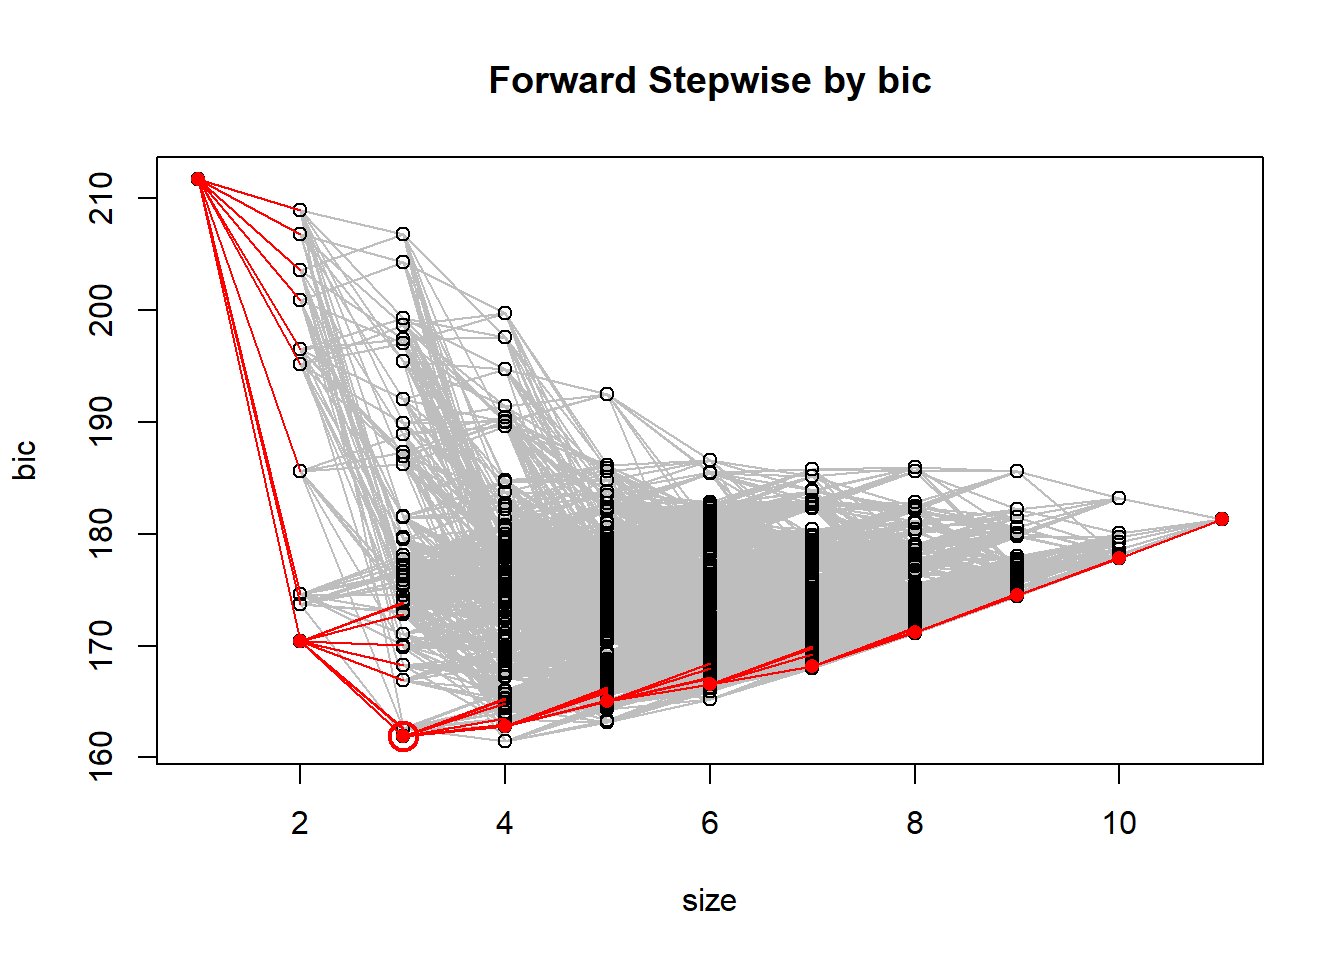
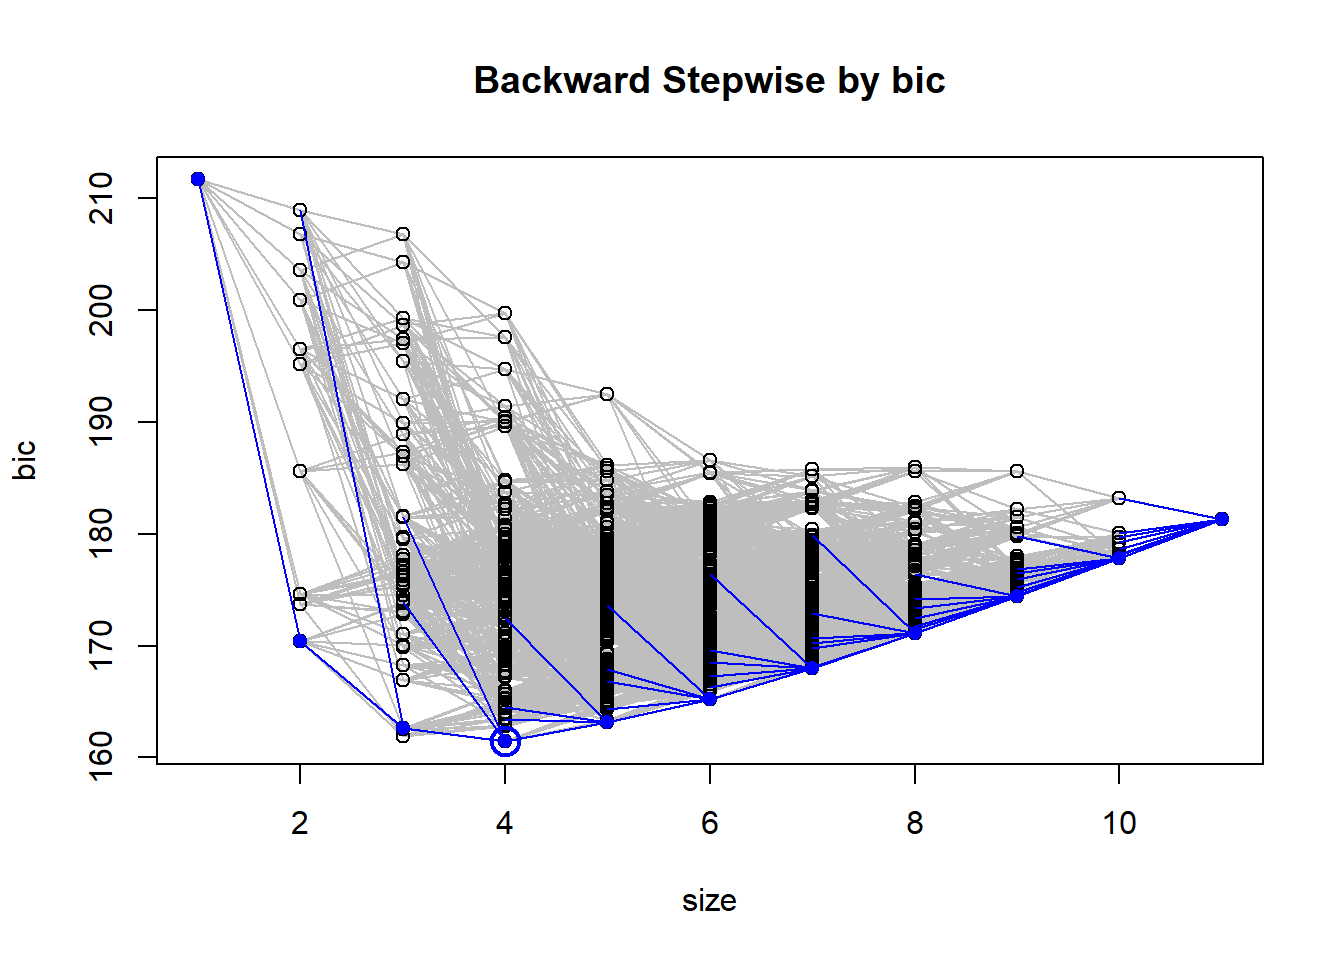
We implement a forward stepwise selection algorithm, and a backwards stepwise selection algorithm. We also have a function that automates K fold validation and gives the formula resulting in the lowest MSE

37.2.2 K fold validation on the models produced
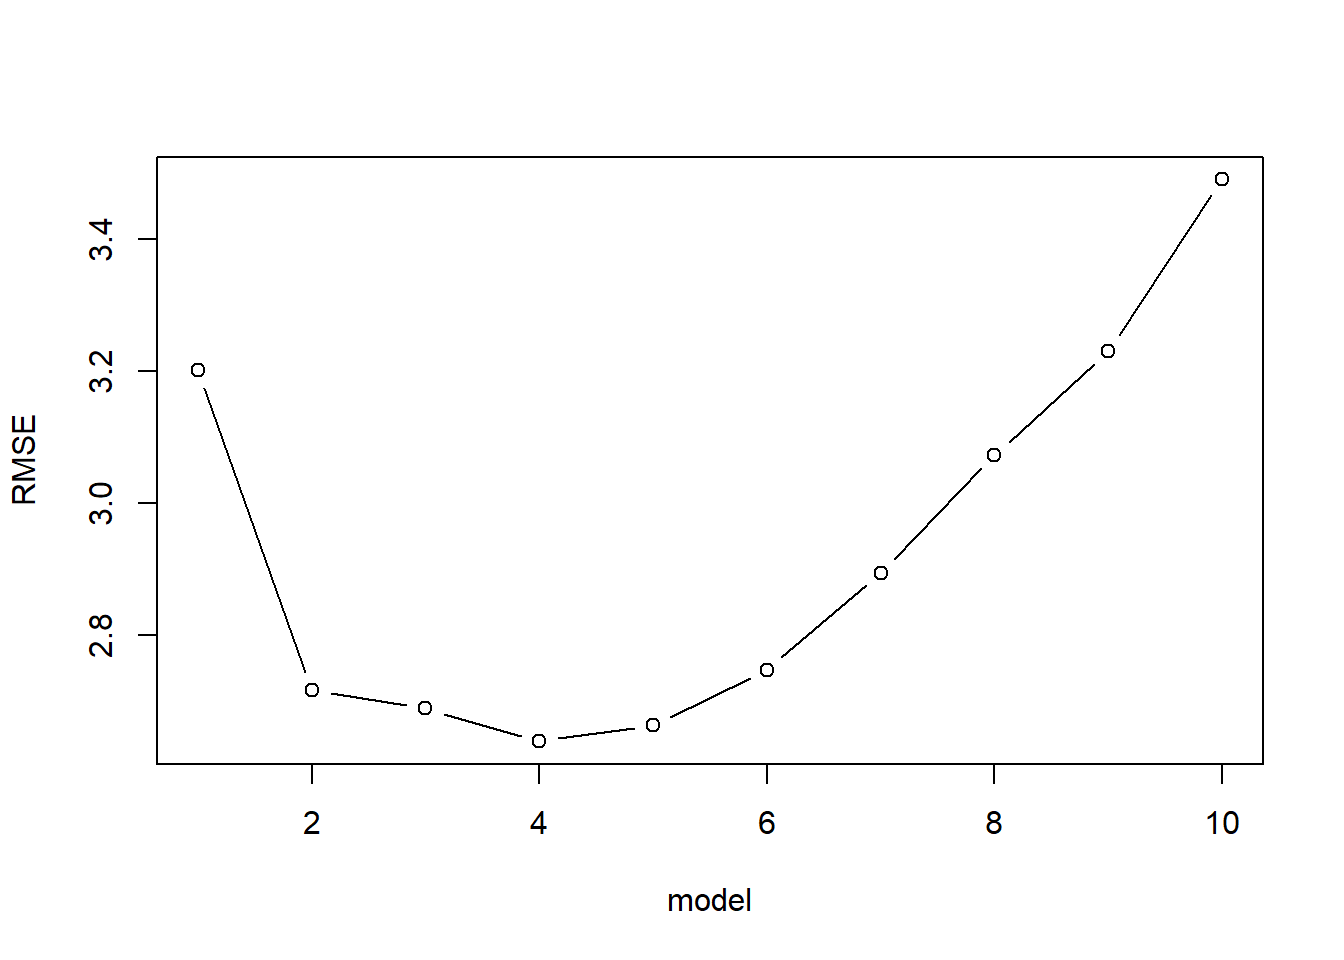
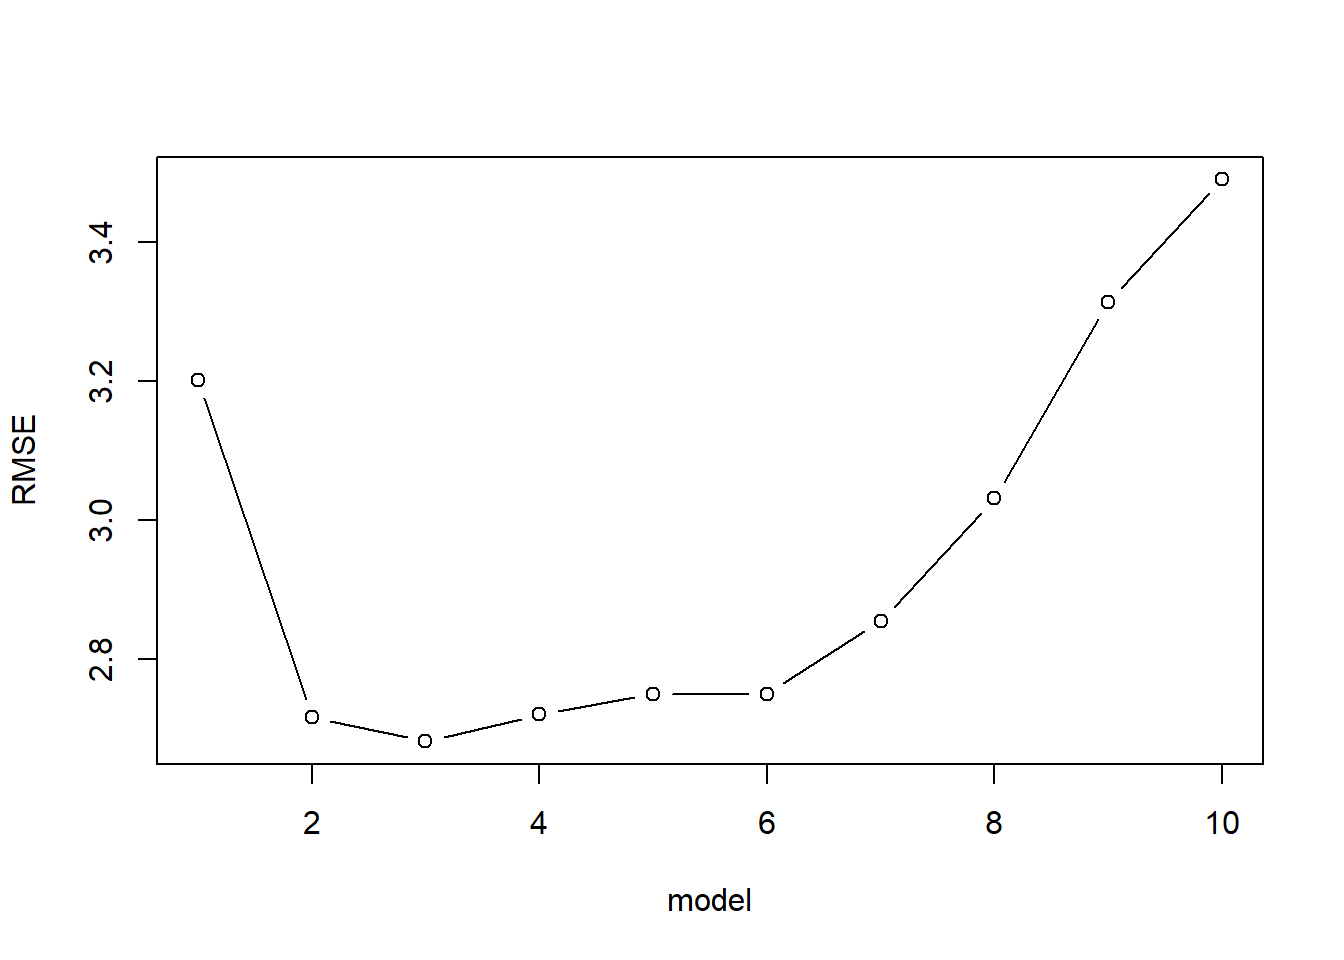
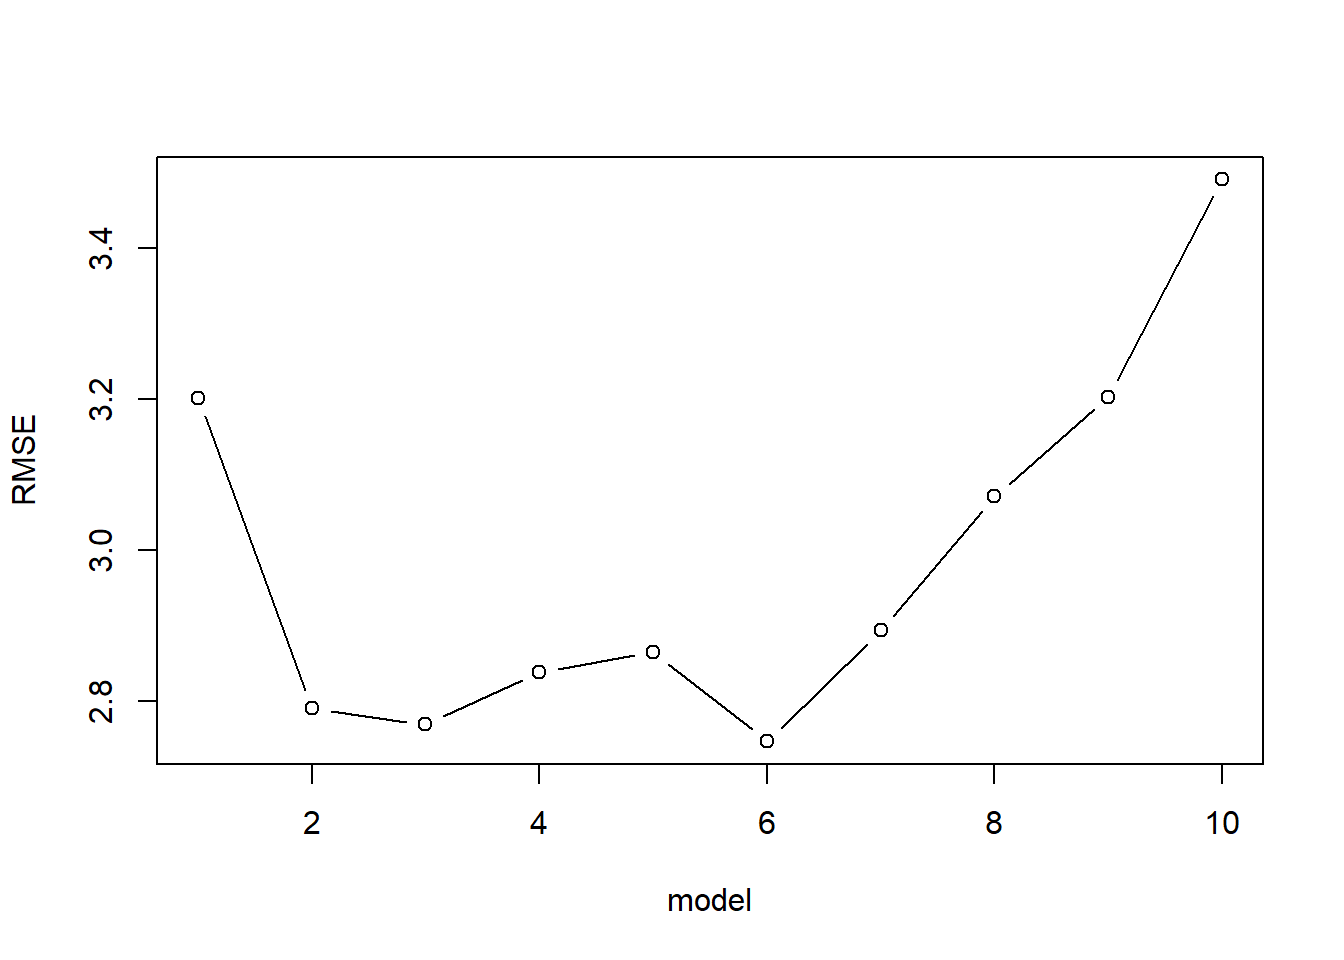
kfoldCV <- function(K, formulas, dataset, responseVar, reps=1){
  m <- length(formulas)

  #an empty data frame to store the results of each validation
  results <- data.frame(fold = rep(rep(1:K, each=m),times=reps),
                        model = rep(1:m, K*reps),
                        error = 0,
                        repl = rep(1:reps, each=m*K))    
  for(r in 1:reps){
    #idx is a shuffled vector of row numbers
    idx <- sample(1:nrow(dataset))
    #folds partitions the row indices
    folds <- split(idx, as.factor(1:K))
    for(k in 1:K){
      #split the data into training and testing sets
      training <- dataset[-folds[[k]],]
      testing <- dataset[folds[[k]],]
      #go through each model and estimate MSE
      for(f in 1:m){
        #fit the model to the training data
        fit <- lm(formula = formulas[[f]], data=training)
        #calculate the average squared error on the testing data
        results[results$fold == k & results$model == f & results$repl==r, "error"] <- mean((predict(fit, newdata=testing) - testing[,responseVar])^2)
      }
    }
  }
  #aggregate over each model & replicate, averaging the error
  aggregated <- aggregate(error~model, data=results, FUN="mean")
  #produces a simple line & dot plot
  plot(sqrt(error) ~ model, type="b", data=aggregated, ylab="RMSE")
#  lines(error ~ model, data=aggregated)
  print(which(aggregated$error == min(aggregated$error)))
  print(formulas[[which(aggregated$error == min(aggregated$error))]])
  return(aggregated)
}

37.2.3 Model Statistics

A function to take in one or more models and return a data frame giving some comparitive model statistics.

createModelStats <- function(formulas, dataset){
  n <- nrow(dataset)
  model.stats <- data.frame('model' = gsub(" ", "", as.character(formulas), fixed = TRUE))
  for(m in 1:length(formulas)){
    modelsum <- summary(lm(formulas[[m]], data=dataset))
    #I am using k = p+1, the number of predictors + the intercept
    model.stats$k[m] <- nrow(modelsum$coefficients)
    model.stats$Rsq[m] <- modelsum$r.squared
    model.stats$Rsq.adj[m] <- modelsum$adj.r.squared
    L <- logLik(lm(formulas[[m]], data=mtcars))[1]
    model.stats$AIC[m] <- -2*L + 2*model.stats$k[m]
    model.stats$BIC[m] <- -2*L + model.stats$k[m] * log(n)
  }
  return(model.stats)  
}

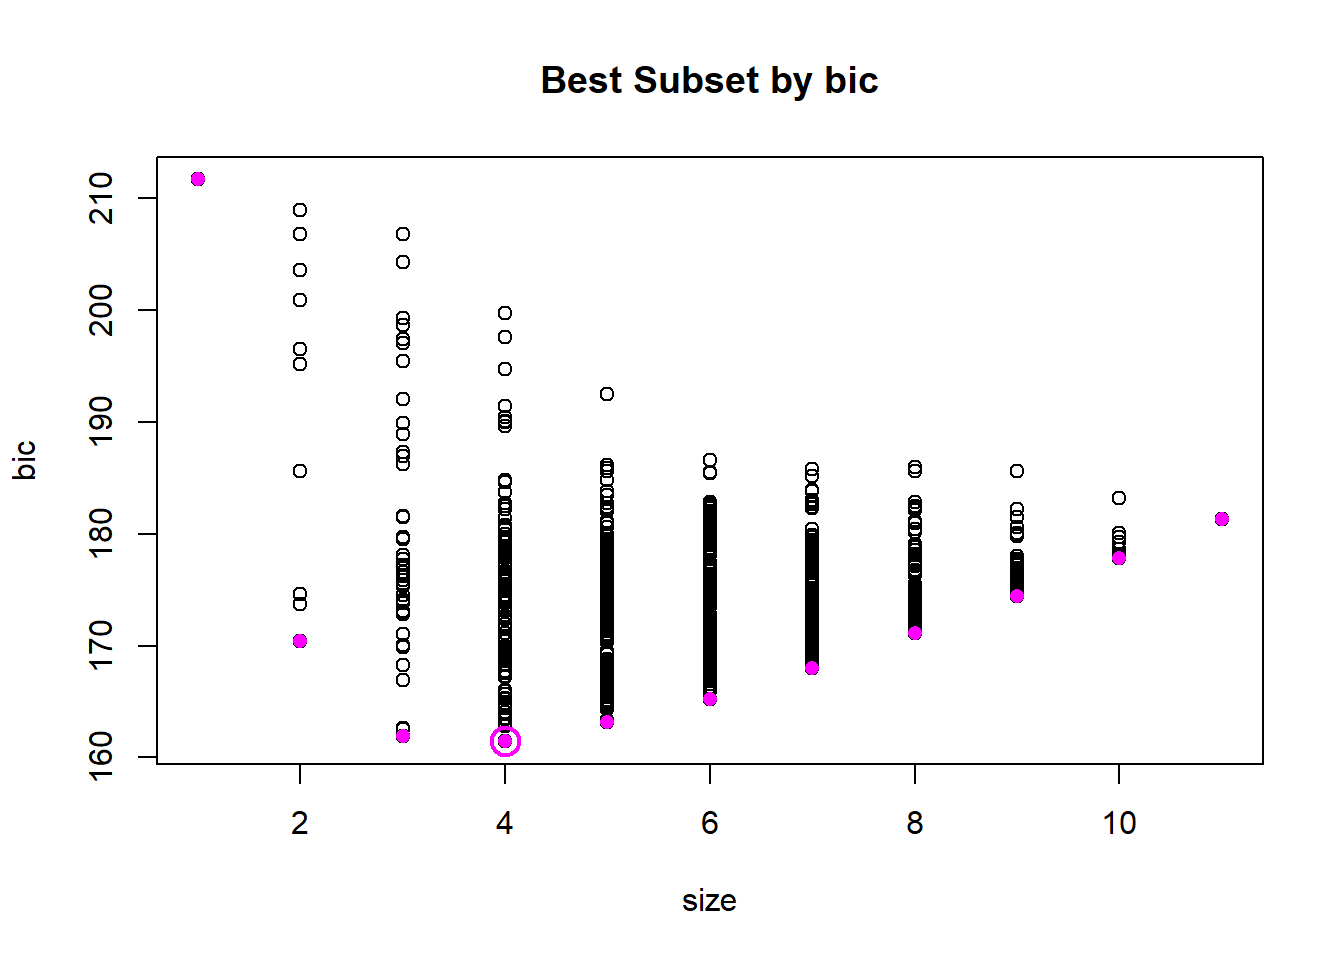
37.2.4 Best Subset Selection

get_model_formula <- function(id, object, outcome){
  # get models data
  models <- summary(object)$which[id,-1]
  # Get model predictors
  predictors <- names(which(models == TRUE))
  predictors <- paste(predictors, collapse = "+")
  # Build model formula
  as.formula(paste0(outcome, "~", predictors))
}  

bestSubsetSelection <- function(dataset, responseVar, maxModelSize){
  library(leaps)
  models <- regsubsets(reformulate(".",responseVar), data = dataset, nvmax = maxModelSize);
  modelList <- list("formula")
  nModels <- models$last-models$first+1
  for(i in 1:nModels){
    modelList[[i]] <- get_model_formula(i, models, responseVar)
  }
  return(modelList)  
}

modelList <- bestSubsetSelection(mtcars, "mpg", 10)
kfoldCV(32, modelList, mtcars, "mpg",1)

[1] 4
mpg ~ hp + wt + qsec + am
<environment: 0x000001abe137afd8>
   model     error
1      1 10.250712
2      2  7.376451
3      3  7.228234
4      4  6.963568
5      5  7.092947
6      6  7.548634
7      7  8.376991
8      8  9.444218
9      9 10.433151
10    10 12.181558
createModelStats(modelList, mtcars)
                                          model  k       Rsq   Rsq.adj      AIC
1                                        mpg~wt  2 0.7528328 0.7445939 164.0294
2                                    mpg~cyl+wt  3 0.8302274 0.8185189 154.0101
3                                mpg~wt+qsec+am  4 0.8496636 0.8335561 152.1194
4                             mpg~hp+wt+qsec+am  5 0.8578510 0.8367919 152.3274
5                        mpg~disp+hp+wt+qsec+am  6 0.8637377 0.8375334 152.9740
6                   mpg~disp+hp+drat+wt+qsec+am  7 0.8667078 0.8347177 154.2687
7              mpg~disp+hp+drat+wt+qsec+am+gear  8 0.8680976 0.8296261 155.9333
8         mpg~disp+hp+drat+wt+qsec+am+gear+carb  9 0.8687064 0.8230390 157.7853
9      mpg~disp+hp+drat+wt+qsec+vs+am+gear+carb 10 0.8689448 0.8153314 159.7271
10 mpg~cyl+disp+hp+drat+wt+qsec+vs+am+gear+carb 11 0.8690158 0.8066423 161.7098
        BIC
1  166.9609
2  158.4073
3  157.9823
4  159.6560
5  161.7684
6  164.5289
7  167.6592
8  170.9769
9  174.3845
10 177.8329

37.2.5 Forward Stepwise Selection

forwardStepwiseSelection <- function(dataset, responseVar){
  predictors = c("1",names(dataset[,-which(names(dataset)==responseVar)]))
  used = 1
  M <- list() #empty list to hold all of the models, except M0
  
  #the null model and its RSS
  M0 <- lm(reformulate(predictors[used], responseVar), data=dataset)
  RSS <- sum(M0$residuals^2)
  
  #the list of formulas to return
  formulas <- list()
  
  for(model in 1:(length(predictors)-1)){
    RSS.best <- RSS
    for(try in predictors[-used]){
      fitModel <- lm(reformulate(c(predictors[used],try), responseVar), data=dataset)
      RSS.new <- sum(fitModel$residuals^2)
      if(RSS.new <= RSS.best){
        new.pred <- try
        RSS.best <- RSS.new
      }
    }
    formulas[[model]] <- reformulate(c(predictors[used],new.pred), responseVar)
    M[[model]] <- lm(formulas[[model]], data=dataset) 
    RSS <- sum(M[[model]]$residuals^2)
    print(paste("adding", new.pred, "; RSS = ", RSS))
    used <- c(used, which(predictors==new.pred))
  }
  return(formulas)  
}

formulas <- forwardStepwiseSelection(mtcars, "mpg")
[1] "adding wt ; RSS =  278.321937543344"
[1] "adding cyl ; RSS =  191.171966255962"
[1] "adding hp ; RSS =  176.620520198822"
[1] "adding am ; RSS =  169.997769193248"
[1] "adding qsec ; RSS =  159.817481197347"
[1] "adding disp ; RSS =  150.991113368961"
[1] "adding drat ; RSS =  149.089856415591"
[1] "adding gear ; RSS =  148.113856122815"
[1] "adding carb ; RSS =  147.654555723284"
[1] "adding vs ; RSS =  147.494430016651"
kfoldCV(32, formulas, mtcars, "mpg")

[1] 3
mpg ~ 1 + wt + cyl + hp
<environment: 0x000001abe0628378>
   model     error
1      1 10.250712
2      2  7.376451
3      3  7.189898
4      4  7.399795
5      5  7.559137
6      6  7.561309
7      7  8.150201
8      8  9.186201
9      9 10.978155
10    10 12.181558
createModelStats(formulas, mtcars)
                                            model  k       Rsq   Rsq.adj
1                                        mpg~1+wt  2 0.7528328 0.7445939
2                                    mpg~1+wt+cyl  3 0.8302274 0.8185189
3                                 mpg~1+wt+cyl+hp  4 0.8431500 0.8263446
4                              mpg~1+wt+cyl+hp+am  5 0.8490314 0.8266657
5                         mpg~1+wt+cyl+hp+am+qsec  6 0.8580721 0.8307783
6                    mpg~1+wt+cyl+hp+am+qsec+disp  7 0.8659105 0.8337290
7               mpg~1+wt+cyl+hp+am+qsec+disp+drat  8 0.8675989 0.8289819
8          mpg~1+wt+cyl+hp+am+qsec+disp+drat+gear  9 0.8684657 0.8227146
9     mpg~1+wt+cyl+hp+am+qsec+disp+drat+gear+carb 10 0.8688736 0.8152309
10 mpg~1+wt+cyl+hp+am+qsec+disp+drat+gear+carb+vs 11 0.8690158 0.8066423
        AIC      BIC
1  164.0294 166.9609
2  154.0101 158.4073
3  153.4766 159.3396
4  154.2536 161.5823
5  154.2776 163.0720
6  154.4596 164.7197
7  156.0541 167.7800
8  157.8439 171.0355
9  159.7445 174.4019
10 161.7098 177.8329

37.2.6 Backwards Stepwise

backwardsStepwiseSelection <- function(dataset, responseVar){
  predictors = c("1",names(dataset[,-which(names(dataset)==responseVar)]))
  used = (1:ncol(dataset))[-which(names(dataset)==responseVar)]
  M <- list()
  Mfull <- lm(reformulate(predictors[c(1,used)], responseVar), data=dataset)
  RSS <- sum(Mfull$residuals^2)
  formulas <- list()
  formulas[[length(used)]] <- reformulate(predictors[used], responseVar)
  
  RSS.best <- RSS
  RSS.worst <- sum(lm(reformulate("1",response=responseVar), data=dataset)$residuals^2)
  print(paste("Full Model RSS: ", RSS))
  for(model in (length(used)-1):1){
    RSS.best <- RSS.worst
    for(try in used){
      modelFit <- lm(reformulate(predictors[used[-which(used==try)]], responseVar), data=dataset)
      RSS.new <- sum(modelFit$residuals^2)
      if(RSS.new <= RSS.best){
        new.pred <- try
        RSS.best <- RSS.new
      }
    }
    formulas[[model]] <- reformulate(predictors[used[-which(used==try)]], responseVar)
    M[[model]] <- lm(formulas[[model]], data=dataset) 
    RSS <- sum(M[[model]]$residuals^2)
    print(paste("removing", predictors[new.pred], "; RSS = ", RSS))
    used <- used[-which(used==new.pred)]
  }
  return(formulas)  
}

formulas <- backwardsStepwiseSelection(mtcars, "mpg")
[1] "Full Model RSS:  147.494430016651"
[1] "removing cyl ; RSS =  147.901098768614"
[1] "removing vs ; RSS =  148.094443018952"
[1] "removing carb ; RSS =  148.528284803963"
[1] "removing gear ; RSS =  150.093255330781"
[1] "removing drat ; RSS =  170.129133515847"
[1] "removing disp ; RSS =  185.635324942769"
[1] "removing hp ; RSS =  186.05929721548"
[1] "removing am ; RSS =  195.463631604656"
[1] "removing qsec ; RSS =  278.321937543344"
kfoldCV(32, formulas, mtcars, "mpg")

[1] 6
mpg ~ disp + hp + drat + wt + qsec + am
<environment: 0x000001abe17b9ee0>
   model     error
1      1 10.250712
2      2  7.792151
3      3  7.671356
4      4  8.057231
5      5  8.212356
6      6  7.548634
7      7  8.376991
8      8  9.433235
9      9 10.257359
10    10 12.181558
createModelStats(formulas, mtcars)
                                          model  k       Rsq   Rsq.adj      AIC
1                                        mpg~wt  2 0.7528328 0.7445939 164.0294
2                                   mpg~wt+qsec  3 0.8264161 0.8144448 154.7205
3                                mpg~hp+wt+qsec  4 0.8347678 0.8170643 155.1426
4                           mpg~disp+hp+wt+qsec  5 0.8351443 0.8107212 157.0696
5                      mpg~disp+hp+drat+wt+qsec  6 0.8489147 0.8198599 156.2784
6                   mpg~disp+hp+drat+wt+qsec+am  7 0.8667078 0.8347177 154.2687
7              mpg~disp+hp+drat+wt+qsec+am+gear  8 0.8680976 0.8296261 155.9333
8           mpg~disp+hp+drat+wt+qsec+vs+am+gear  9 0.8684829 0.8227378 157.8397
9       mpg~cyl+disp+hp+drat+wt+qsec+vs+am+gear 10 0.8686546 0.8149224 159.7979
10 mpg~cyl+disp+hp+drat+wt+qsec+vs+am+gear+carb 11 0.8690158 0.8066423 161.7098
        BIC
1  166.9609
2  159.1177
3  161.0056
4  164.3983
5  165.0728
6  164.5289
7  167.6592
8  171.0313
9  174.4553
10 177.8329

37.2.7 Visualization of Models Selection Methods

responseVar <- "mpg"
predictors <- names(mtcars)[-which(names(mtcars)==responseVar)]
nFormulas <- 2^length(predictors)

number2binary = function(number, noBits) {
       binary_vector = rev(as.numeric(intToBits(number)))
       if(missing(noBits)) {
          return(binary_vector)
       } else {
          binary_vector[-(1:(length(binary_vector) - noBits))]
       }
}

allModels <- data.frame(i=0:(nFormulas-1))
for(predictor in predictors){
  newdf <- data.frame(x=numeric(nFormulas)); names(newdf) <- predictor
  allModels <- cbind(allModels, newdf)
}
allModels$size <- 0
allModels$aic <- 0
allModels$bic <- 0
allModels$adjr2 <- 0
for(i in allModels$i){
  allModels[i+1, 2:11] <- number2binary(i, length(predictors))
  if(i==0){
    f <- reformulate("1", responseVar)
  } else {
    f <- reformulate(predictors[allModels[i+1,2:11]==1], responseVar)
  }
  allModels[i+1, "size"] <- sum(allModels[i+1, 2:11])+1
  fit <- lm(f, data=mtcars)
  allModels[i+1, "adjr2"] <- summary(fit)$adj.r.squared
  allModels[i+1, "aic"] <- AIC(fit)
  allModels[i+1, "bic"] <- -2*as.numeric(logLik(fit)) + log(nrow(mtcars))*(allModels[i+1, "size"]+1) 
}

edges <- data.frame(from=numeric(), to=numeric())
for(i in allModels[-nrow(allModels),"i"]){
  to <- i + 2^(which(rev(allModels[i,2:11]==0))-1)
  from <- rep(i, length(to))
  edges <- rbind(edges, data.frame(from,to))
}
criterion <- "bic" #or "bic" or "adjr2"

which.best <- function(x){
  if(criterion=="adjr2") return (which.max(x)) else return (which.min(x))
}

bestSubset <- numeric()
for(size in unique(allModels$size)){
    bestSubset[size] <- allModels[allModels$size==size, "i"][which.best(allModels[allModels$size==size, criterion])]+1
}

bestForward <- numeric()
for(size in unique(allModels$size)){
  if(size==1) bestForward[size] <- 1
  else {
    bestForward[size] <- allModels[edges[edges$from==bestForward[size-1],"to"] , "i"][which.best(allModels[edges[edges$from==bestForward[size-1],"to"], criterion])]+1
  }
}

bestBackward <- numeric(max(allModels$size))
for(size in rev(unique(allModels$size))){
  if(size==11) {bestBackward[size] <- 1024}
  else {
      bestBackward[size] <- allModels[edges[edges$to==bestBackward[size+1],"from"] , "i"][which.best(allModels[edges[edges$to==bestBackward[size+1],"from"], criterion])]+1
  }
}

allModels$compare <- allModels[,criterion]

plot(compare~size, data=allModels, main=paste("Best Subset by",criterion), ylab=criterion)
points(compare~size, data=allModels[bestSubset,], col="magenta", pch=16)
points(compare~size, data=allModels[bestSubset[which.best(allModels[bestSubset,criterion])],], col="magenta", cex=2, lwd=2)

plot(compare~size, data=allModels, main=paste("Forward Stepwise by",criterion), ylab=criterion)
segments(allModels[edges$from,"size"],allModels[edges$from,criterion],allModels[edges$to,"size"],allModels[edges$to,criterion], col="gray")
points(compare~size, data=allModels)
edgesForward <- subset(edges, from %in% bestForward)
segments(allModels[edgesForward$from,"size"],allModels[edgesForward$from,criterion],allModels[edgesForward$to,"size"],allModels[edgesForward$to,criterion], col="red")
points(compare~size, data=allModels[bestForward,], col="red", pch=16)
points(compare~size, data=allModels[bestForward[which.best(allModels[bestForward,criterion])],], col="red", cex=2, lwd=2)

plot(compare~size, data=allModels, main=paste("Backward Stepwise by",criterion), ylab=criterion)
segments(allModels[edges$from,"size"],allModels[edges$from,criterion],allModels[edges$to,"size"],allModels[edges$to,criterion], col="gray")
points(compare~size, data=allModels)
edgesBackward <- subset(edges, to %in% bestBackward)
segments(allModels[edgesBackward$from,"size"],allModels[edgesBackward$from,criterion],allModels[edgesBackward$to,"size"],allModels[edgesBackward$to,criterion], col="blue")
points(compare~size, data=allModels[bestBackward,], col="blue", pch=16)
points(compare~size, data=allModels[bestBackward[which.best(allModels[bestBackward,criterion])],], col="blue", cex=2, lwd=2)